Session 1: Software and Cities included papers from Matthew Wilson (Harvard and Kentucky Universities) and Martin Dodge (University of Manchester). Here are links to the slides the complete program.
Tag Archives: smart cities
Launch Videos: Introduction – Rob Kitchin, PI Programmable City Project, NIRSA, NUIM
Seminar reminder: Citizens, Data, Virtual Reality and the Internet of Things
Welcome back!
After the Launch event earlier this week, we are really happy to have Dr Andy Hudson-Smith to discussion Citizens, Data, Virtual Reality and the Internet of Things! Please see the details of our next seminar below.
Time: 16:00 – 18:00, Wednesday, 2 April, 2014
Venue: Room 2.31, 2nd Floor Iontas Building, North Campus NUI Maynooth (Map)
Abstract
Every day, we create 2.5 quintillion bytes of data — so much that 90% of the data in the world today has been created in the last two years alone. This data comes from everywhere: sensors used to gather climate information, posts to social media sites, digital pictures and videos, purchase transaction records, and cell phone GPS signals to name a few (IBM, 2103). This data can, compared to traditional data sources, be defined as ‘big’. Cities and urban environments are the main sources for big data, every minute 100,000 tweets are sent globally, Google receives 2,000,000 search requests and users share 684,478 pieces of content on Facebook (Mashable, 2012). An increasingly amount of this data stream is geolocated, from Check-ins via Foursquare through to Tweets and searches via Google Now, the data cities and individuals emit can be collected and viewed to make the data city visible, aiding our understanding of now only how urban systems operate but opening up the possibility of a real-time view of the city at large (Hudson-Smith, 2013). The talk explores systems such as The City Dashboard (http://www.citydashboard.org) and the rise of the Internet of Things (IoT) in terms of data collection, visualization and analysis. Joining these up creates a move towards the Smart City and via innovations in IoT a look towards augmented reality pointing towards the the creation of a ‘Smart Citizen’, ‘the Quantified Self’ and ultimately a Smart City.
IBM (2103), Big Data at the Speed of Business, http://www-01.ibm.
Mashable (2012), How Much Data is Created Every Minute, http://mashable.com/
Hudson-Smith (2013) – Tagging and Tracking, Architectural Design, 01, 2014, High Definition, Zero Tolerance in Design and Production.
Speaker bio
Dr Andrew Hudson-Smith is Director of the Centre for Advanced Spatial Analysis (CASA) at The Bartlett, University College London. Andy is a Reader in Digital Urban Systems and Editor-in-Chief of Future Internet Journal, he is also an elected Fellow of the Royal Society of Arts, a member of the Greater London Authority Smart London Board and Course Founder of the MRes in Advanced Spatial Analysis and Visualisation and MSc in Smart Cities at University College London.
Rob Kitchin's Oxford Internet Institute Bellwether Lecture
Rob Kitchin presented a Bellwether Lecture at the Oxford Institute Institute on February 28th entitled ‘The Real Time City? Big Data and Smart Urbanism’. OII have just uploaded the webcast of the full lecture. The written version of the paper was recently published in Geojournal (visit GeoJournal website or Download). Kitchin, R. (2014) The real-time city? Big data and smart urbanism. GeoJournal 79(1): 1-14.
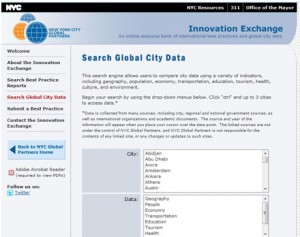
Interactive city benchmarking sites
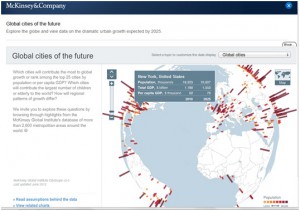
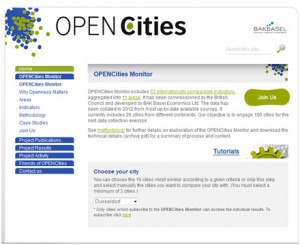
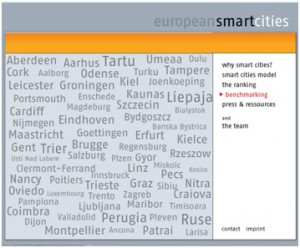
Over the past few years there have been a proliferation of city benchmarking indexes and data tools that enable the comparison of different phenomenon across cities. A recent Jones Lang LaSalle report details 150 of them. Such indexes are composed of composites of key indicators and are proported to give an indication of city performance vis-a-vis other locales and to judge how city administrations and policies are fairing. Below are some links to some interactive city benchmarking sites that allow the comparison of selected cities. Our interests in such benchmarking is in the politics of indicator selection and the formulation of indices, and how the data are employed, a topic that we’ve just started to examine on the ProgCity project.
NYC Global Innovation Exchange: http://www.nyc.gov/html/ia/gprb/html/global/global.shtml
OPENCities Monitor: http://www.opencities.eu/web/index.php?monitor_en
Siemens Green City Index: http://www.siemens.com/entry/cc/en/greencityindex.htm

Intercultural City Index: http://www.culturalpolicies.net/web/intercultural-cities-charts.php

Smart cities index (mid-size cites , 100-500K population): http://www.smart-cities.eu/benchmarking.html
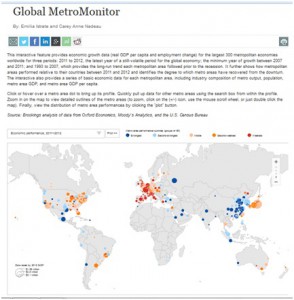
Brookings GlobalMonitor: http://www.brookings.edu/research/interactives/global-metro-monitor-3
McKinsey Urban World: http://www.mckinsey.com/insights/urbanization/urban_world
LSE European Metromonitor: http://labs.lsecities.net/eumm/m/metromonitor

Seminar 4: Citizens, Data, Virtual Reality and the Internet of Things – Revisiting the City
Hi everyone,
For our next seminar, we have invited Dr Andy Hudson-Smith to discussion Citizens, Data, Virtual Reality and the Internet of Things!
Time: 16:00 – 18:00, Wednesday, 2 April, 2014
Venue: Room 2.31, 2nd Floor Iontas Building, North Campus NUI Maynooth (Map)
Abstract
Every day, we create 2.5 quintillion bytes of data — so much that 90% of the data in the world today has been created in the last two years alone. This data comes from everywhere: sensors used to gather climate information, posts to social media sites, digital pictures and videos, purchase transaction records, and cell phone GPS signals to name a few (IBM, 2103). This data can, compared to traditional data sources, be defined as ‘big’. Cities and urban environments are the main sources for big data, every minute 100,000 tweets are sent globally, Google receives 2,000,000 search requests and users share 684,478 pieces of content on Facebook (Mashable, 2012). An increasingly amount of this data stream is geolocated, from Check-ins via Foursquare through to Tweets and searches via Google Now, the data cities and individuals emit can be collected and viewed to make the data city visible, aiding our understanding of now only how urban systems operate but opening up the possibility of a real-time view of the city at large (Hudson-Smith, 2013). The talk explores systems such as The City Dashboard (http://www.citydashboard.org) and the rise of the Internet of Things (IoT) in terms of data collection, visualization and analysis. Joining these up creates a move towards the Smart City and via innovations in IoT a look towards augmented reality pointing towards the the creation of a ‘Smart Citizen’, ‘the Quantified Self’ and ultimately a Smart City.
IBM (2103), Big Data at the Speed of Business, http://www-01.ibm.
Mashable (2012), How Much Data is Created Every Minute, http://mashable.com/
Hudson-Smith (2013) – Tagging and Tracking, Architectural Design, 01, 2014, High Definition, Zero Tolerance in Design and Production.
Speaker bio
Dr Andrew Hudson-Smith is Director of the Centre for Advanced Spatial Analysis (CASA) at The Bartlett, University College London. Andy is a Reader in Digital Urban Systems and Editor-in-Chief of Future Internet Journal, he is also an elected Fellow of the Royal Society of Arts, a member of the Greater London Authority Smart London Board and Course Founder of the MRes in Advanced Spatial Analysis and Visualisation and MSc in Smart Cities at University College London.


