by: Tracey P. Lauriault
Note – I have received some feedback since last night and have updated the post accordingly. Thanks to those who provided it!
 The Republic of Ireland, Department of Public Expenditures and Reform (DPER) launched its first Open Data Pilot Portal data.gov.ie on July 22nd. The new portal was created by INSIGHT Galway who answered the DPER call for tender of January 24, 2014. The following suite of products were delivered on April 7th and officially approved by the Government on July 1st. This is an important milestone.
 DPER/INSIGHT Research Documents:
- Best Practice Handbook
- Data Audit Report
- Roadmap
- Evaluation Framework
- Open Data Publication Handbook
On the following day, July 23rd, the Government released Ireland’s first Open Government Partnership (OGP) National Action Plan. The newly launched data.gov.ie portal falls within Ireland’s OGP Plan under section 4 entitled: Open Data and Transparency – opening-up Government data for greater accountability, improving public services and achieving economic growth. It was also something civil society, academia and government have been advocating for, for some time.
 The first draft of this plan was released at the OGP European Regional Meetings held in Dublin in May of 2014, and part of the package of deliverables listed above are related to Ireland’s May 2013 commitments to join the OGP. The Government also aspires to sign onto the G8 Open Data Charter. The OGP plan was informed by a number of stakeholders from civil society, academia and the public and private sectors. The documentation related to this process is available on the OGP page for Ireland and on the Open Knowledge Foundation Ireland website. There are many strategies in these reports, if implemented, will greatly make government more accessible and transparent to the public.
Subsequently, the DPER invited members of the public service, involved with the production and dissemination of public sector data in Ireland, to attend an information session, held on the 29th of July, to discuss the documents, the portal, to solicit feedback on the development of an open data strategy for the Republic and to seek support. A public briefing will also be held September 8th with civil society stakeholders and the public who have been actively engaged in the production of the OGP DRAFT Plan and engaged in Open Data and open government in Ireland.
This blog post is the first of a three part series on open data.
- This post sketches part of the open data landscape for the past 5 years.
- The next post will discuss the DPER/INSIGHT documents, the portal and provide recommendations.
- The final will discuss the open government plan.
Sketching the Open Data Landscape in Ireland
Members of the Programmable City Project have been actively engaged in the theory and practice of open data and making data accessible in both Ireland and Canada for 15 years. As part of this ERC funded Project researchers are producing open data genealogies and data assemblages for Ireland, Canada and Boston in the US. The following is but a sketch of the open data landscape in Ireland. In the last 5 years much important work has been done prior to the DPER launch and it important to feature some of this work as it provides context to the Irish Open Data Story.
The public sector in collaboration with the private and academic sectors have been advocating for both open data and open government for some time.  For example, In June of 2011, National Cross Industry Working Group was formed “to support and inform government in the delivery of their Open Data objectives. [They were] committed to realising Open Data opportunities for Government, society and industry while simultaneously re-enforcing [Ireland’s] international reputation as a global technology hub”. Their Report includes recommendations, many of which were included in the DPER/INSIGHT reports and a history of open data activities from 2009-2011. WG members also held a number of events as part of Open Data Week between Nov. 7-11 in 2011. Shrotly thereafter, on November 17, 2011, the DPER as part of its 2011 Public Sector Reform Plan includes making data more accessible and opening government more broadly. The current DPER/INSIGHT reports are therefore not the first time the government announces open data and open government plans.
data.gov.ie is also not the first portal as other levels of government, civil society and academia, as well as the private sector have: produced their own portals, have integrated portals; have shared some of their own datasets; have added value to some; have produced some civic apps and have helped shape the discourse of openess.
Many of the early public and academic sector data dissemination initiatives, in Ireland would not be considered as pure ‘open data’ according to the Open Definition. Some of the County level portals listed below might not meet all of the open criteria, since many stipulate that data cannot be used for commercial purposes or passed onto third party entities. The Fingal Open Data portal is the exception. These would be classified as open access to data projects. They are nonetheless precursors to the ‘open data’ DPER launch. These initiatives have been sharing their data as part of their normal dissemination practices or as an institutional policy. For example, statistical and geospatial data producing communities in particular are renowned for their good practices in Ireland and internationally.
The following is a selection of open access, open data and transparency initiatives in Ireland:
County Level Public Sector Data Portals: 
- Fingal Open Data (Launched Nov. 2010)
- County Clare Open Datasets
- Open Data for Limerick
- Sligo Open Data
- Roscommon County Council Open Data Portal
- County Galway MapZone, and Maps
Civil Society Initiatives:
- Open Street Map (OSM) Ireland and Maps.openstreetmap.ie (mapping since 2005).
 OSM volunteers produce framework geospatial datasets and disseminate them under an open licence;
 - Kildare Street (launched 2009) makes parliamentary records accessible and records what parliamentarians say and do;
- Active Citizen (founded 2010) has been working with and
 advocating for Ireland becoming a member of the Open Government Partnership since 2011, and develop. In 2012 an OGP Business Case which included the fostering of an open data ecosystem was provided to DPER. It founded the Open Knowledge Foundation Ireland local group (2013) which became OKF Ireland Chapter (2014);
- CKan Open Data Portal (launched September 2013), it is no longer on line. An inventory of close to 200 public sector data initiatives were added into this demo portal during a one day hackathon;
- Open Data Ireland held numerous civic hackathons and meetups.
Academic
- AIRO.ie (All-Island Research Observatory launched 2010), dis
 seminates datasets from agencies both from the North and the South as interactive online graphs and maps and also in an open data store. It was initially the Cross-Border Regional Research Observatory founded in 2006.
Public, Academic and Private Sector Partnership
Dublinked.ie ![]() (Launched June 2011), a partnership project which disseminates a variety of static and real time data.
(Launched June 2011), a partnership project which disseminates a variety of static and real time data.
Public & Private Sector
There are far too many open access to data initiatives in Ireland to list here, the DPER/INSIGHT Data Audit Report provides a partial list, organizations like AIRO have created their own inventories which they make accessible in their Data Store, the Irish Spatial Data Exchange![]() (ISDE) has integrated the metadata of a number of important data catalogs, dublinked.ie lists hundreds in their portal and the Ckan portal, now offline, listed close to 200 initiatives in a one day hackathon. The private sector also disseminates data on behalf and with the public sector.
(ISDE) has integrated the metadata of a number of important data catalogs, dublinked.ie lists hundreds in their portal and the Ckan portal, now offline, listed close to 200 initiatives in a one day hackathon. The private sector also disseminates data on behalf and with the public sector. ![]() ESRI Ireland for examples disseminate data in a number of ways, as products and as web services services. Finally, there is also the GeoPortal.ie which was developed by the Department of Environment, Community & Local Government (DECLG) and Ordnance Survey Ireland (OSi) with guidance and oversight fromIrish public bodies on the Irish Spatial Data Infrastructure (ISDI) project steering committee.
ESRI Ireland for examples disseminate data in a number of ways, as products and as web services services. Finally, there is also the GeoPortal.ie which was developed by the Department of Environment, Community & Local Government (DECLG) and Ordnance Survey Ireland (OSi) with guidance and oversight fromIrish public bodies on the Irish Spatial Data Infrastructure (ISDI) project steering committee.
The following is a very small list of how some public sector organization open access to data initiatives disseminate their data:
- licences – some have adopted to disseminate their data under the Re-Use of Public Sector Information Licence (PSI) (i.e., Central Statistics Office, Environmental Protection Agency GeoPortal); others have developed a consensus based licence and approach to the dissemination of large collections of data as part of a funded preservation, archiving and research project (e.g., Digital Repository of Ireland);
- directive – some data are produced and disseminated as the outcome of the implementation of the EU INSPIRE directive (e.g., Geoportal, Irish Spatial Data Exchange and the Marine Institute,);
- integrated and interoperability – spatial data infrastructures, and spatial data strategies are integrated web based geospatial data delivery processes that include standards, portals, interoperability and framework data. Geoportal, ESRI, AIRO, EPA, Marine, Fingal, Roscommon, DECLG mentioned earlier and many others have been disseminating their data in this way for quite some time.
- terms and conditions – some data are shared according to pre-existing agreements between researcher and research participant (e.g., Irish Qualitative Data Archive);
- practices – whereby data that are value added (e.g., cleaned, aggregated, geocoded, mapped, visualized, analyzed) often in partnership with a public sector institution are simply disseminated as data or rendered into maps (E.g., All-Island Research Observatory).
- Linked data: data are made discoverable according to linked data principles such as the Central Statistics Office.
Shaping the Terrain:
There a number of initiatives that help shape debates on openness and transparency and some of these are:
- TheStory.ie sheds light on law, policy and freedom of information in Ireland (based on Gavin’s Blog launched in 2002);
- Creative Commons Ireland produces open licences enabling data producers to share their data more openly (founded in 2003);
- Transparency International Ireland is involved in work related to transparency and accountability (founded in 2004);
- Coder Dojo builds capacity by teaching people to code and to understand open source and open data (founded in 2011);
- advocating open access publishing, Open Access Ireland (committee formed in 2012).
- Code for Ireland (launched January 2014), apps are voluntarily created in a hackathon type of environment with open data, or data are produced to address civic issues and these are rendered into apps.
- A number of app contests and hackathons have been taking place since 2010.
Indicators and Evaluation
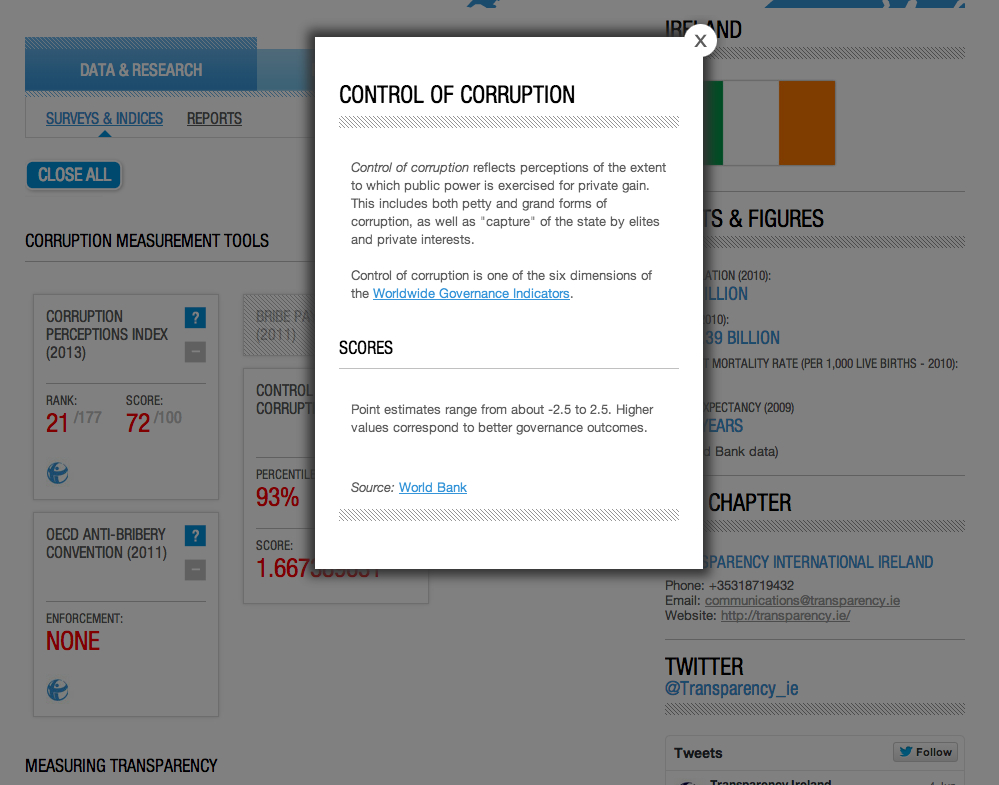
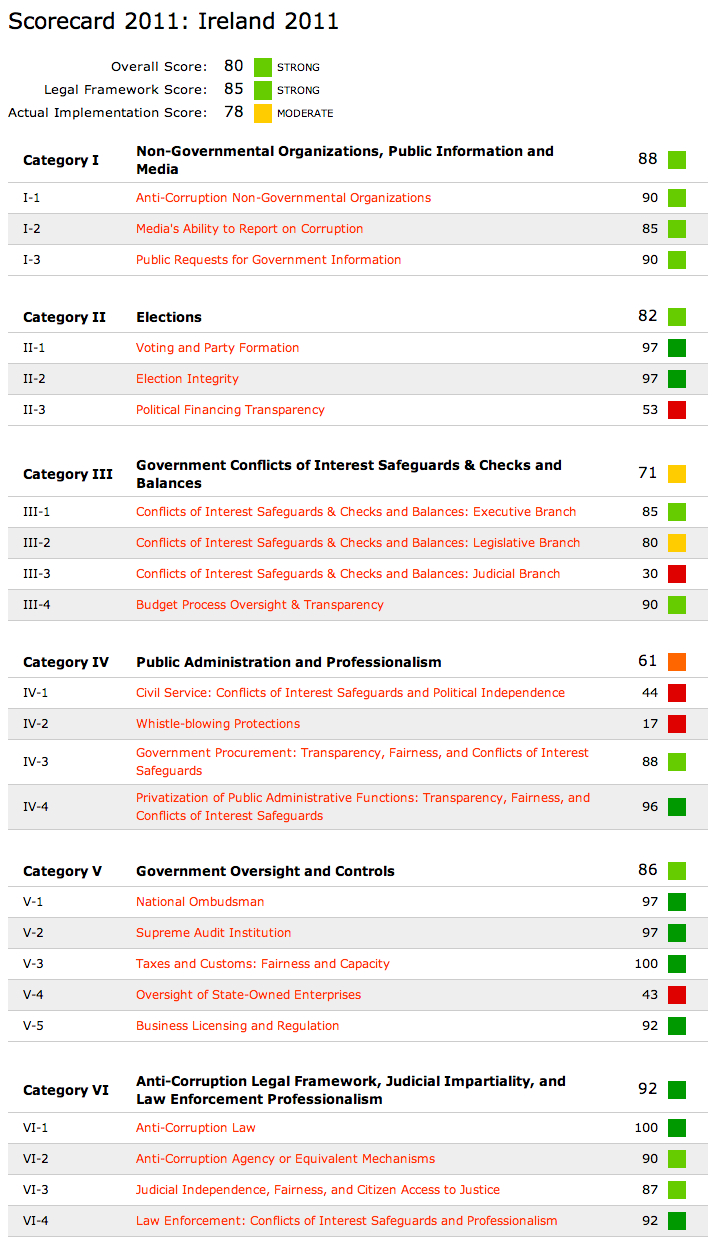
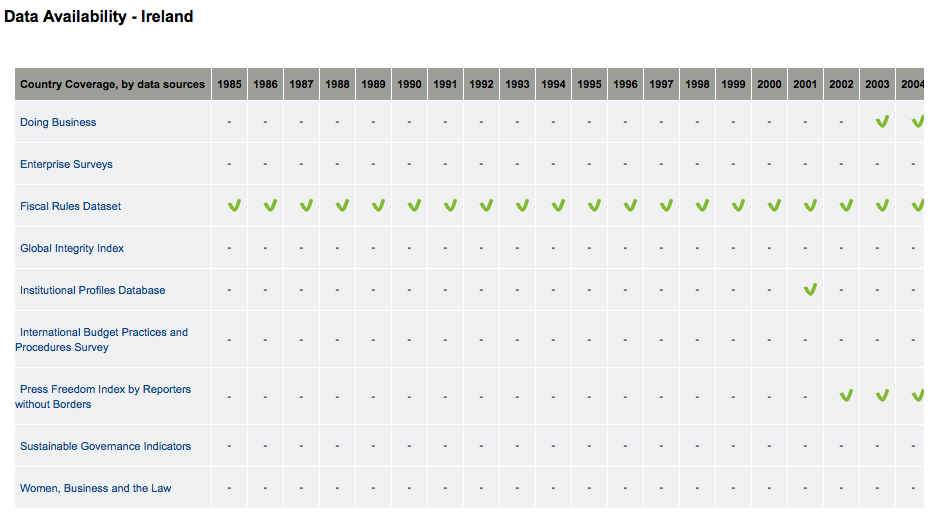
Ireland’s openness has also been ranked according to a number of measures, and these too have inspired action within and outside the public service. These ranking schemes were discussed in an earlier post entitled on Mapping Openness and Transparency.
Research
Finally, there are research projects which are part of a new emerging field called critical data studies, The Programmable City Project being one of the few doing so internationally, and data discovery and semantic interoperability projects such as the INSIGHT Linked Data project based at NUIG.
Open Data Assemblage
The above is by no means complete nor exhaustive list of projects and activities. ![]() For instance the open source community; the private sector (e.g., IBM); lawyers, geomaticians, scientists, programmers, journalists, business associations, citizen scientists, and other individuals; are part of this landscape. As are those who provide collaborative working spaces (e.g., T-Cube);
For instance the open source community; the private sector (e.g., IBM); lawyers, geomaticians, scientists, programmers, journalists, business associations, citizen scientists, and other individuals; are part of this landscape. As are those who provide collaborative working spaces (e.g., T-Cube);  sponsors of open data events (i.e., ESRI) or donate space (i.e., the Engine Yard, Facebook); informal virtual server use arrangements, or the library community. Furthermore, only the OGP, EU and OKF are mentioned as international influences, yet there are other national programs (e.g., UK, US), NGOs, standards organizations, and data infrastructures that are a part of this story. A data assemblage analysis will be used as a way to situate these actors in the open data and the data landscape in Ireland in general.
Some motivating factors and issues:
Open data stakeholders prior to the launch of the DPER/INSIGHT documents and the portal, were motivated into action because of a number of issues beyond transparency, efficiency and collaboration. The following is a sample of some of the more high level issues:
- the disappointment and missed public benefit opportunity of the postal code system (eircode.ie) in Ireland, both how it is being deployed, the cost recovery model and the regressive licencing regime (See Map Scribbles for details). the fees, and general lackadaisical approach to fulfilling Freedom of Information requests, See The Story for backgrounder.
- the cost recovery and licencing practices of the Ordnance Survey Ireland (OSI). OSI produces important framework data that are mostly inaccessible to civil society, and are costly even to the public sector, who also have to pay for them. The OSI has however begun to share some of its data to some academic institutions. Beyond access, it means that important work is not being done, effort is being duplicated, and framework data standards are being undermined as people are creating their own datasets. Open Street Map in Ireland is an OSI workaround, and in the UK, the lack of access to OS data spearheaded the UK Guardian open data campaign.
- Uncertainty about the procurement agreements between the city and the private sector regarding access to data and the science behind the deployment of smart city like sensor initiatives.
These issues have not gone away, and some were debated during the Open Government Partnership meetings in Dublin, have been discussed in the media, and the DPER/INSIGHT Best Practice Handbook briefly addresses others.
Local Context:
Finally, the local context matters, the history of the public sector and its reform, the political economy which includes foreign direct investment and the political system in general provide a backdrop for the unique made in Ireland version of open data. This will be studied more fully as part of the Programmable City genealogical and data assemblage research.
Until then, this sketch of the Irish open data landscape illustrates the rich culture of openness in Ireland, has identified some programs, stakeholders and issues that pre-existed release of data.gov.ie and the DPER/INSIGHT documents. The documents did not discuss these projects in any great detail, which is unfortunate as much expertise exists in and outside of the public sector in Ireland and capturing best practices and mobilizing that knowledge would be beneficial. Others were very briefly addressed in the Open Government Plan.
The DPER did however invite some of these actors to their July 29th and the up and coming September meetings and there is now a mandate for greater collaboration between stakeholders and the government. And DPER is soliciting feedback more generally on these plans.


